
Within Copilot Studio, we now have the capability to achieve a greater complexity with agents in Microsoft 365. Triggers allow us to implement a sense of autonomy with agents giving us the ability to create generative AI powered software entities that augment a process based on natural language instructions and skills we've enabled the agent with, to speed up the transformation of processes across organisations whilst creating greater and more simplistic links between them.
One of the capabilities we can give an agent, is the ability to use a Power Automate flow as a skill or 'action'. Amongst other things agents can use as actions such as bot framework skills, Power Platform connector actions and AI Builder prompts, Power Automate can be leveraged to slot a more deterministic capability into a wider AI augmented chain of events.
Some of the difficulties that come with using Power Automate within Copilot Studio agents point to debugging when we operate an agent at scale. Out of the box, there isn't a quick and easy link between a conversation that an agent had, and that flow run which failed. So, in this post I'm going to show you how to mix working with topics and flows in custom engine agents build in Copilot Studio, with custom telemetry logged to Application Insights to make the debugging experience a breeze!
Let's explore a custom engine agent in Copilot Studio
First up, let's explore a custom engine agent (custom agent) that I've built in Copilot Studio. I have an agent for administrative tasks in a GP healthcare scenario. The agent has simple capabilities focused on actioning administrative tasks such as booking a follow up appointment or recording a checkup. AI is not used for decision making, medical advice or prescribing medication.
One of the topics I have in this agent to support a slightly more deterministic workflow is one to record a checkup. This agent still implements AI orchestration so that it can use other skills, actions and knowledge sources to support new user prompts. Let's step through this topic.
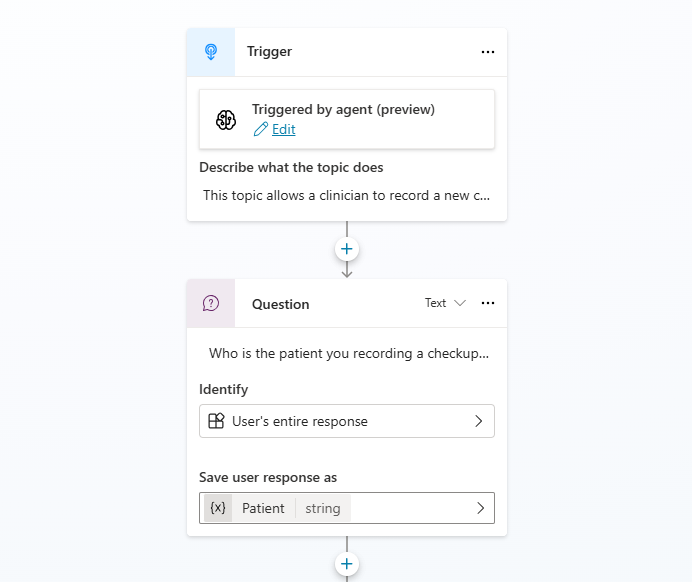
First up, I have a trigger with a description as follows: "This topic allows a clinician to record a new checkup capturing all the necessary details to be stored against the patient record."
Then I have the agent ask a question which queries the user on who the checkup is for. The agent then saves the response in a variable and identifies the name within the users response.
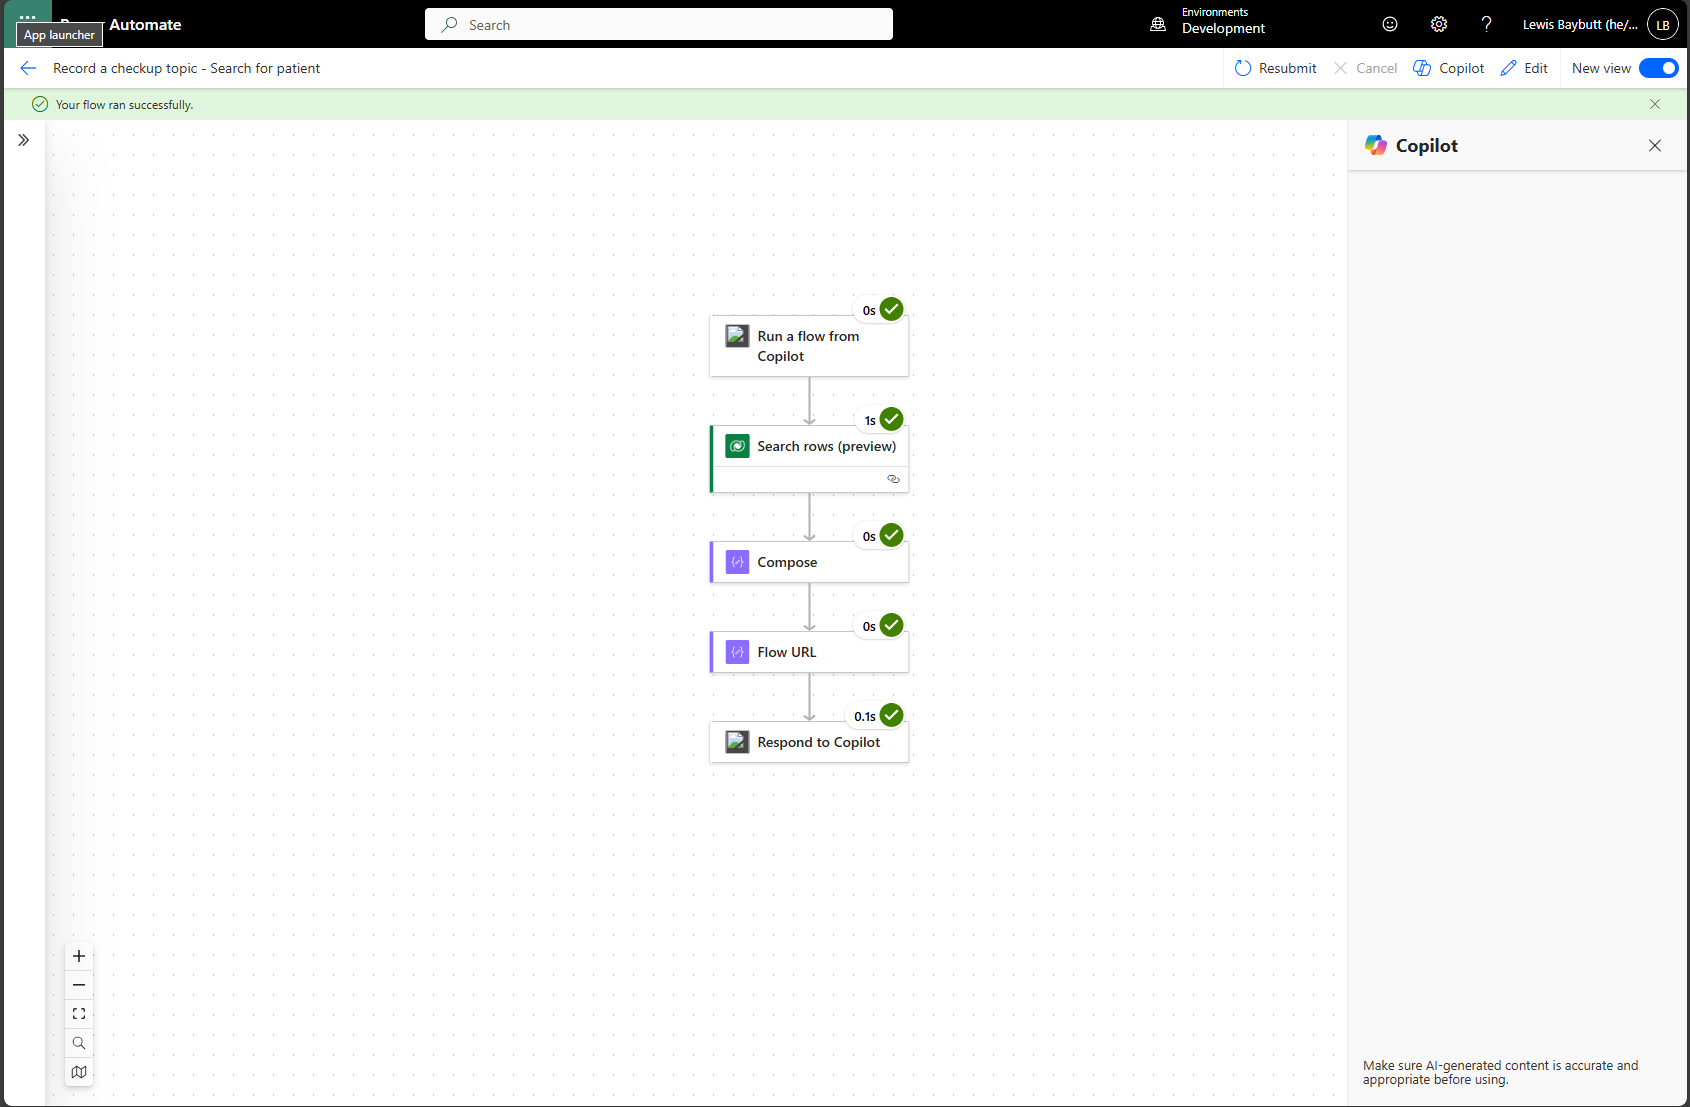
Now because I'm working with natural language, I can't just lookup a record for the patient in Dataverse with it's ID. Instead I'm going to search for the user, which is an action only available in Power Automate and not Copilot Studio directly. So here is the part where we introduce a new flow and things become complicated with debugging when we have errors or unexpected results that users report. So let's dive into a solution.
Enabling the Application Insights integration
To enable the Application Insights integration, first ensure you have an Application Insights resource deployed to a subscription in Microsoft Azure.
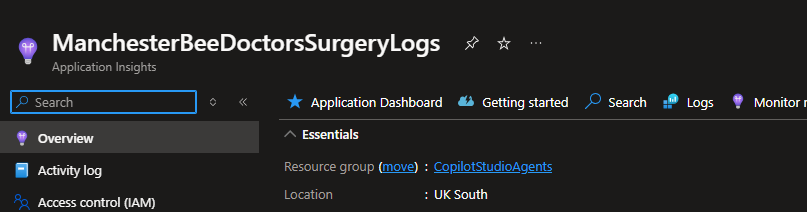
Next you'll need to copy the connection string which you can find on the overview page of the resource. We'll paste this into our agent's configuration.
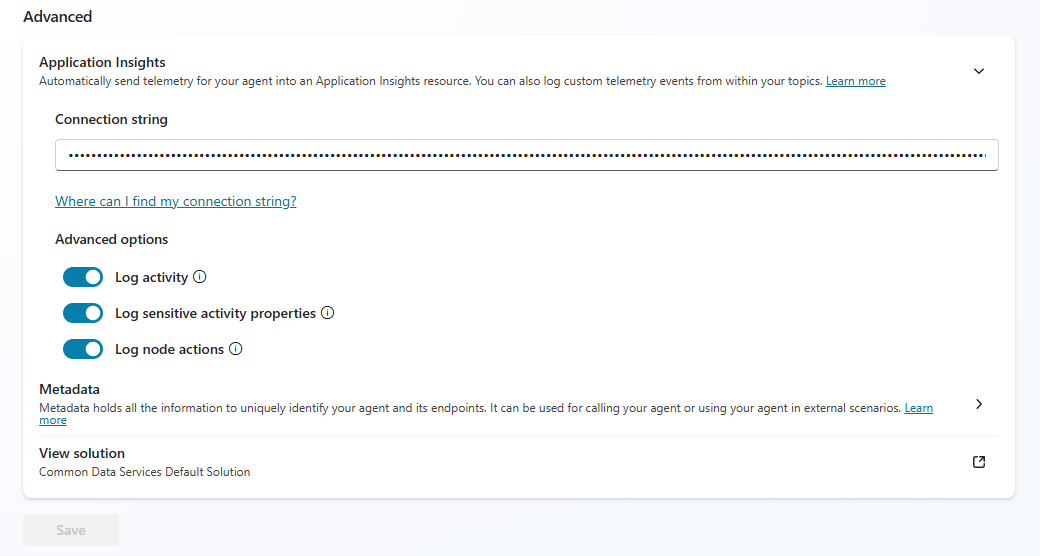
Head over to your agent again in Copilot Studio, and select settings. Then select 'Advanced' followed by 'Application Insights'. Then paste your connection string in the connection string field and enable the logs you want to push to application insights.
So now that we've configured the application insights integration you'll start to notice telemetry appearing for sessions your users have with your agent. But we want to now create custom telemetry for enabling easier debugging of our flows that may fail or have edge cases.
Heading over to my Power Automate flow I'm going to add an output with an expression which get sent back to my agent.
I'm going to add the following expression to a text output which will send the active flow run URL to my agent:
concat('https://unitedkingdom.flow.microsoft.com/manage/environments/',workflow()?['tags']['environmentName'],'/flows/',workflow()?['name'],'/runs/',workflow()?['run']['name'])Flow run URL expression using workflow() function
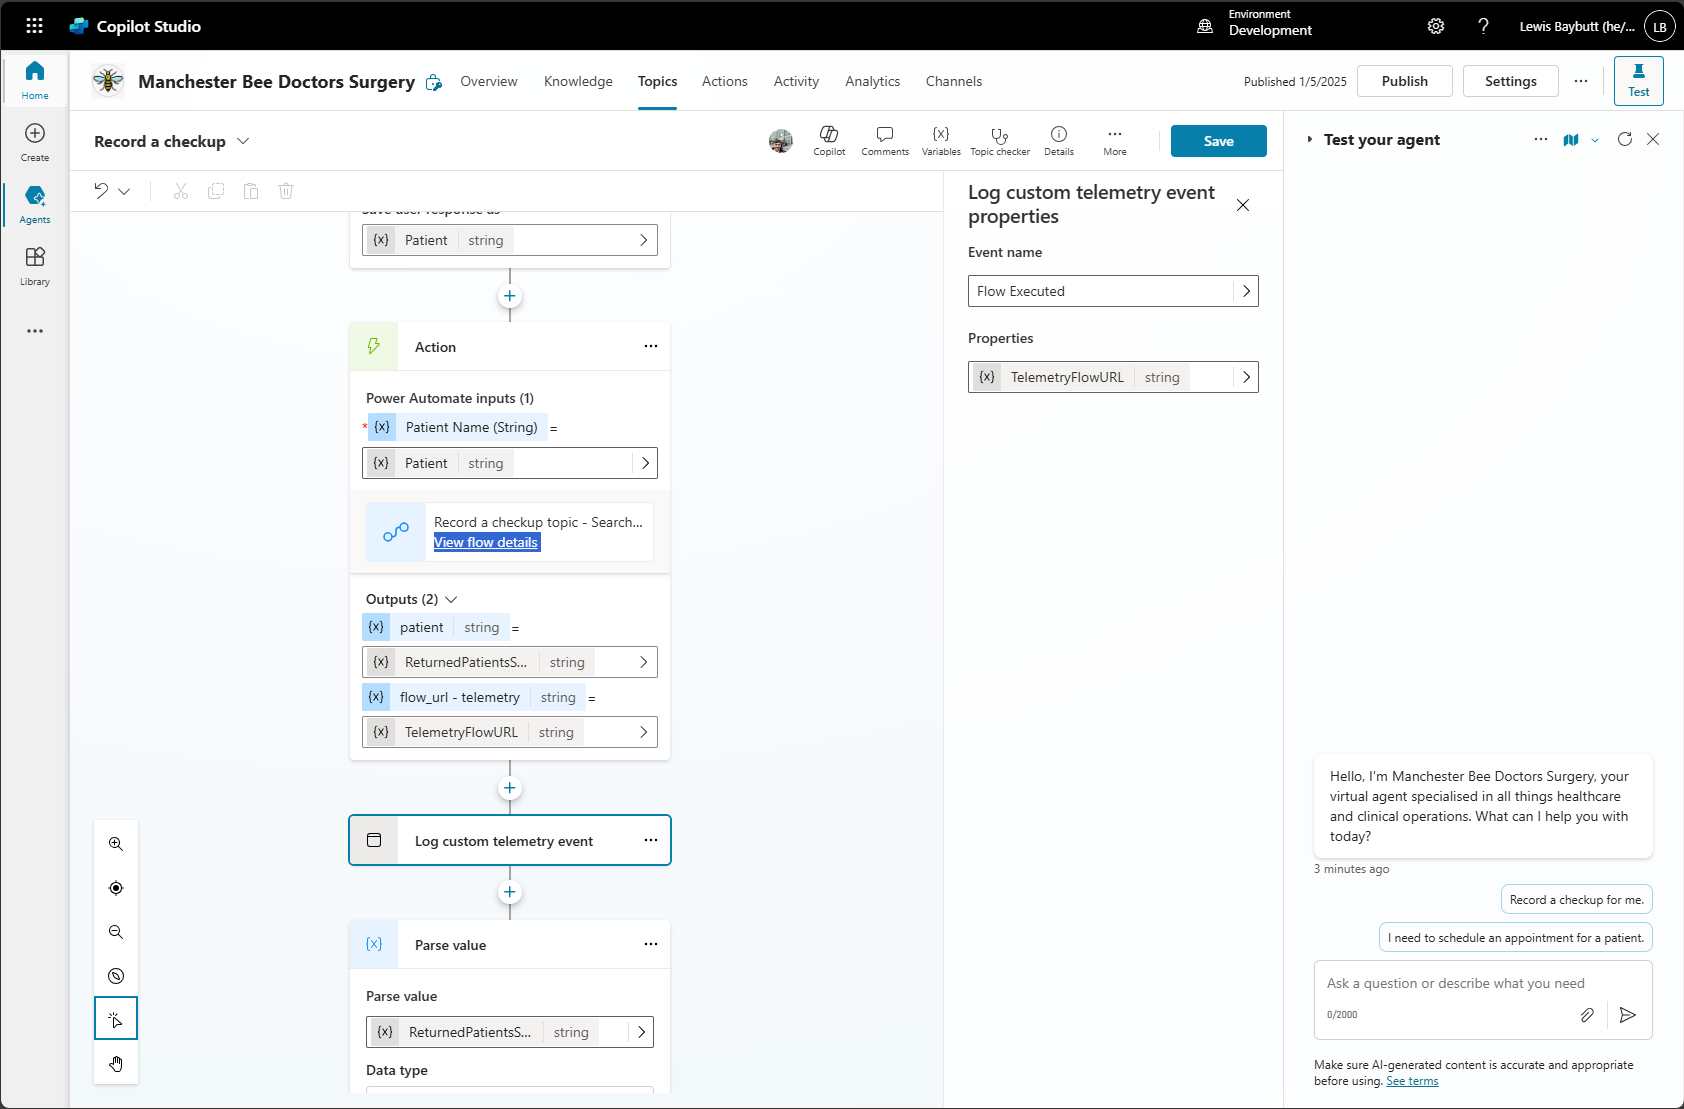
Now back in Copilot Studio, within my topic I'm going to log a custom telemetry event to push this data (the flow run URL) into Application Insights attached to the current conversation session.
Linking it all together
Now let's say for example I am testing my agent and have a scenario where things have gone wrong. I'm going to grab the conversation id for my session by selecting the elipses, then flag an issue and I'll grab the conversation id.
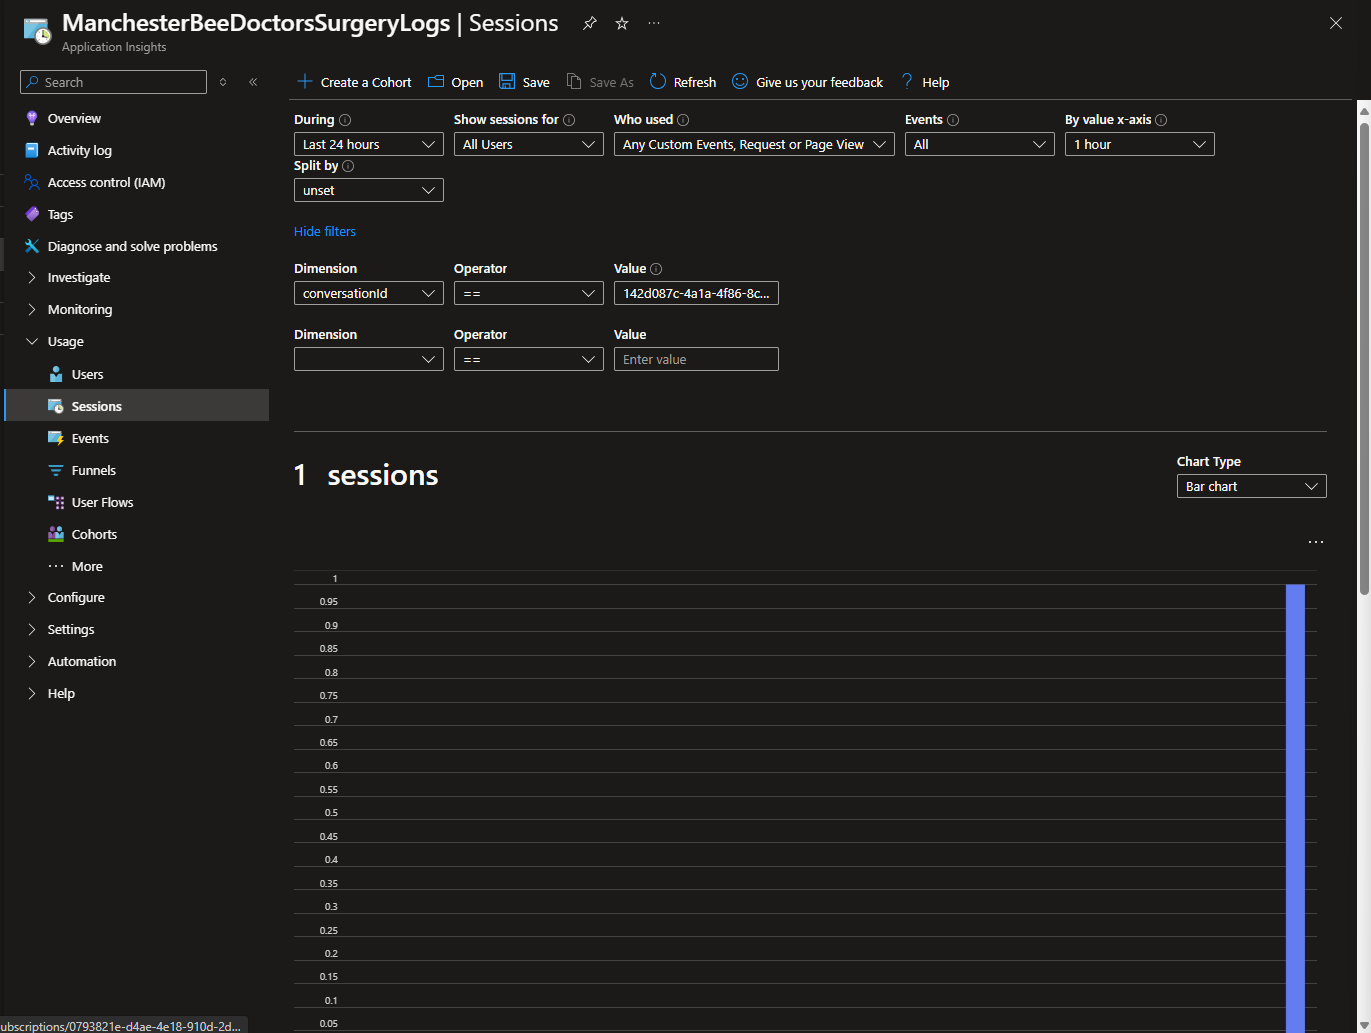
Then I'll head over to application insights, I'll select sessions and I'll filter on the conversation id.
Next, I'll select View more insights under the graph and I'll select to view the session timeline.
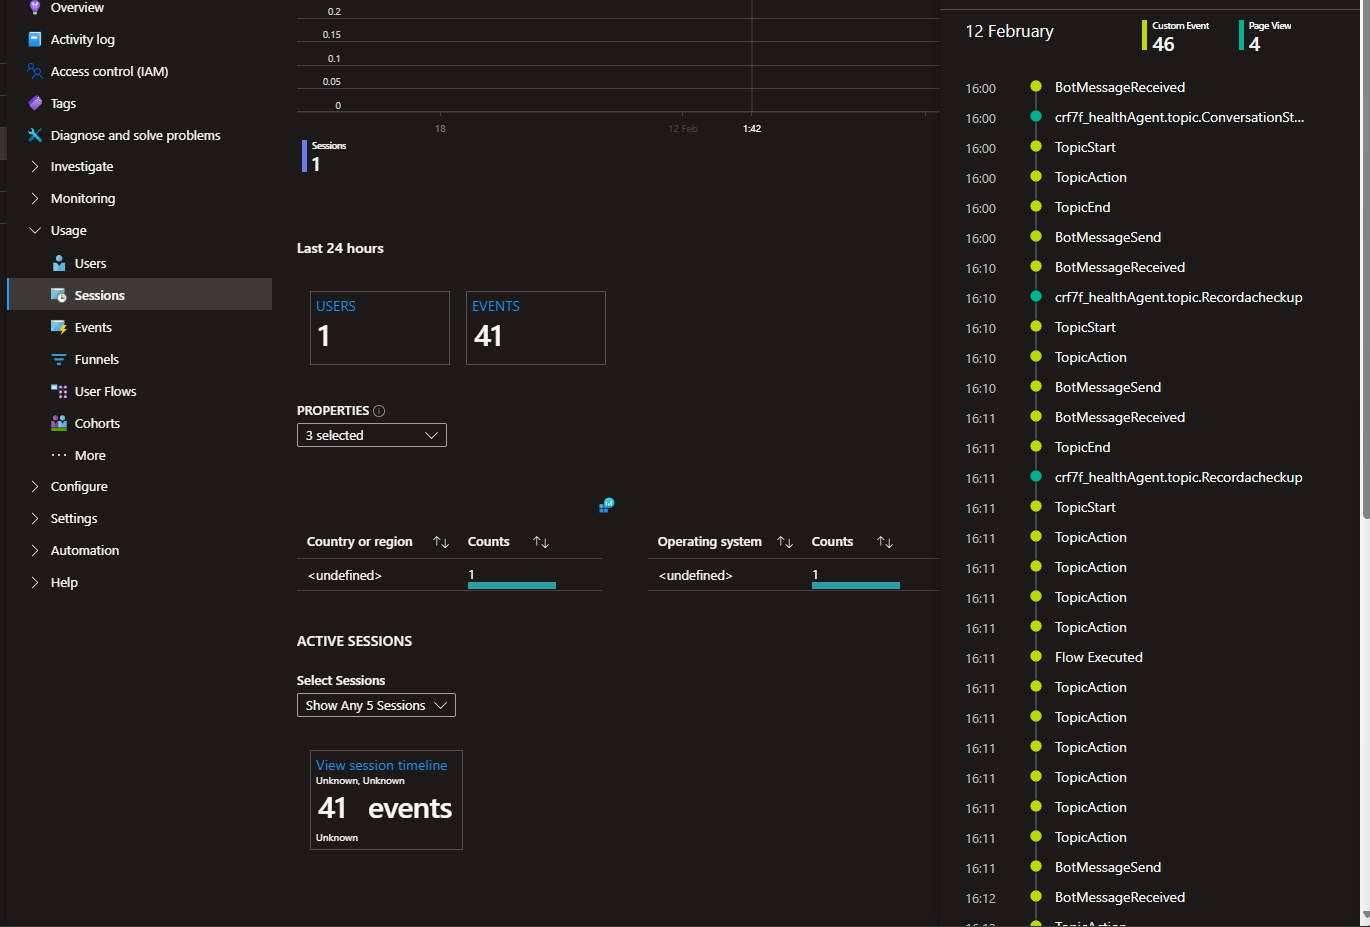
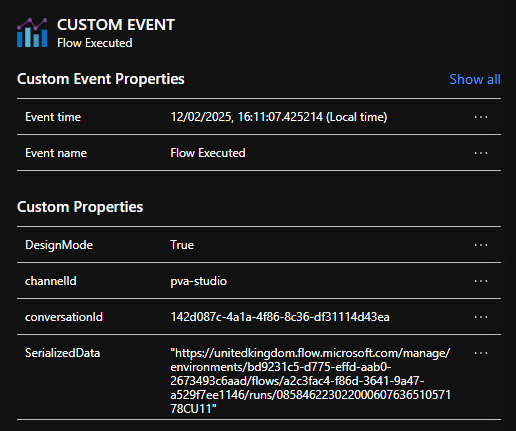
Now we can see I have a telemetry event for 'Flow Executed'. If I click on this I'll be able to deep dive on that event and see the event properties. One of them will be my Power Automate flow run so I can now link back to my flow run and observe the error!
And it's as simple as that! Now I'm able to create links between flows running in Power Automate and conversation sessions with unexpected results and responses from an agent to get down to what a problem might be, or why I'm getting poor responses from my agent.
If you found this post helpful, please be sure to subscribe to my blog for free, so you can stay tuned on the content I put out on the Microsoft Cloud.