Do you utilise the power of business insights dashboards built on Microsoft Fabric and Power BI in your organisation? Ever have users reviewing carefully crafted dashboards with key metric’s and analytics, delivering huge benefits but then having them wonder, how do I take action on these things? Perhaps they identified a problem from a specific metric with a business process, or something more specific and granular like a specific record and they now need to action something against that.
Well… in this blog post, I’ll show you how we can enable an experience which can serve as a solution to these scenarios! We’ll look at how you can embed Power Apps in Power BI reports to create a more interactive experience for business users.
Service Desk Cases
Let’s take a look at a very simple scenario. Here in Power BI, I’m reporting on a table of service desk cases that have been reported to a team in my business. I want to be able to select a case and then take an action on it like updating its status or priority.
To achieve this I’m going to embed a Power Apps solution into my Power BI report where I’ll be able to then drill down on a record and make changes to it in my embedded Power Apps solution.

Configure drill through
The first thing I’m going to do is configure drill through in my report. To do this, I’m going to create a new page.

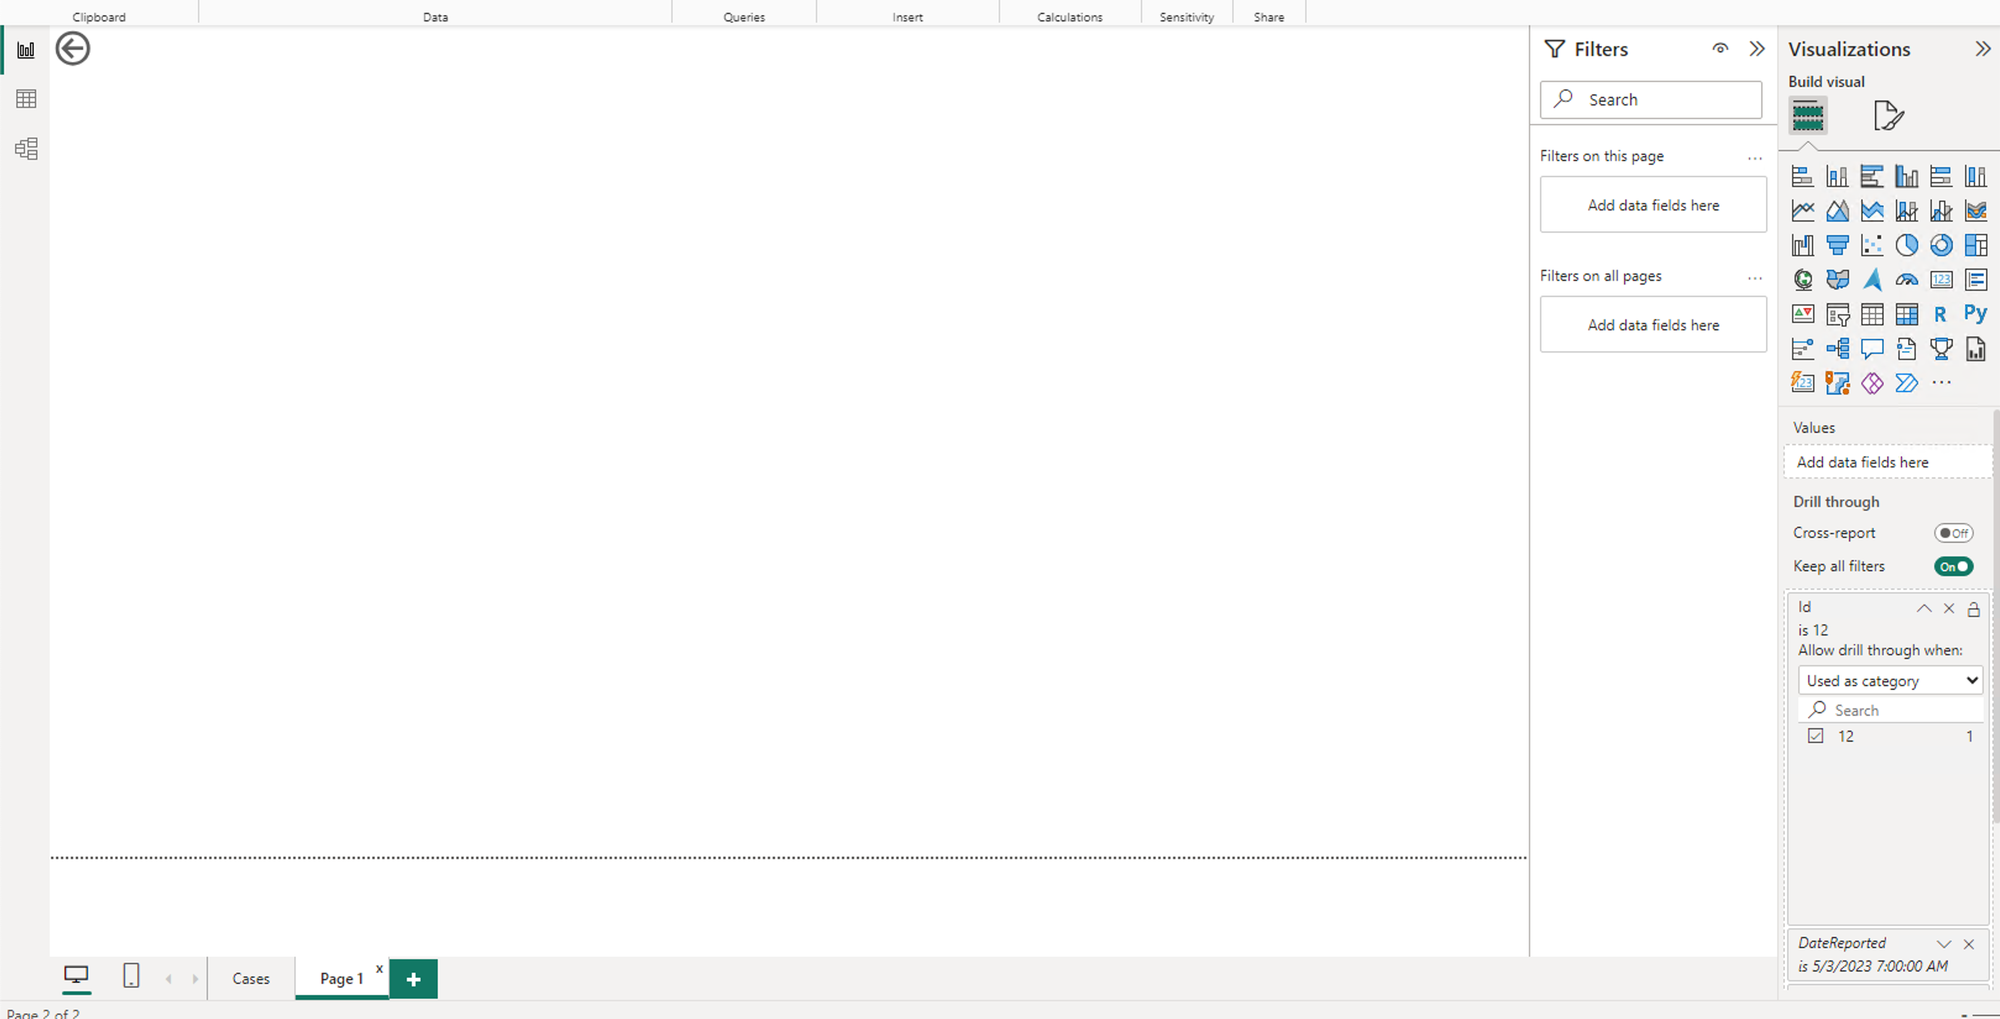
Then on the new page, I’m going to add the data column I’ll need to feed through to my Power Apps solution as an identifier to the drill through fields.
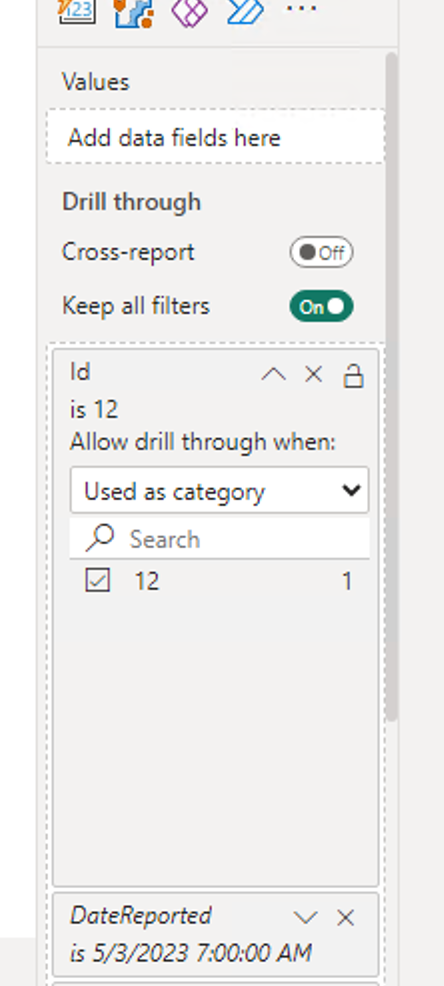
You should notice now, that an arrow has appeared in the top left hand corner of this page.
Now I’ll head back to my Cases page in my report and ensure the same ID field is on the table where I’ll drill through from. Then I’ll right click on a record and test it out.
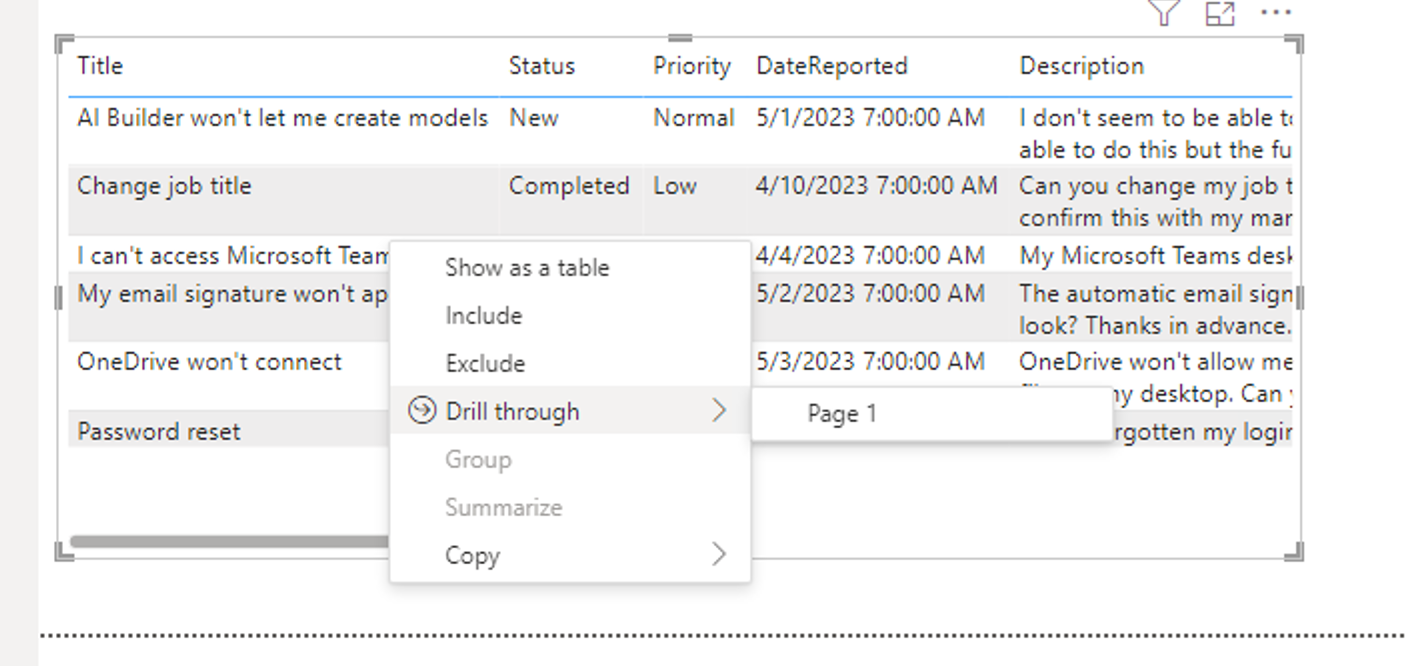
There we go, I now have my drill through working where it’ll carry across an ID from my cases selection to the next page. Now I need to carry that ID into an app with a form where I can make my changes. Let’s work on this now.
Embedded Power Apps app
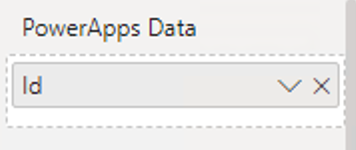
Now let’s add the Power Apps visual to the report page and add the identifier field to the Power Apps data parameter.
Next I’ll select the three dots on the visual and select edit. Here we’ll now be able to create an app to work here or choose an existing one. I’m going to create a new app and continue to Power Apps to finalise the data connection and enable Power BI and Power Apps to work together.
I’m going to start by setting my OnVisible property of the screen created to this formula.
Set(gblCase, LookUp(Cases, ID = Int(First([@PowerBIIntegration].Data).Id)))Next I’ll add a form to my screen and point it towards my Cases list and then set the item as my variable gblCase.
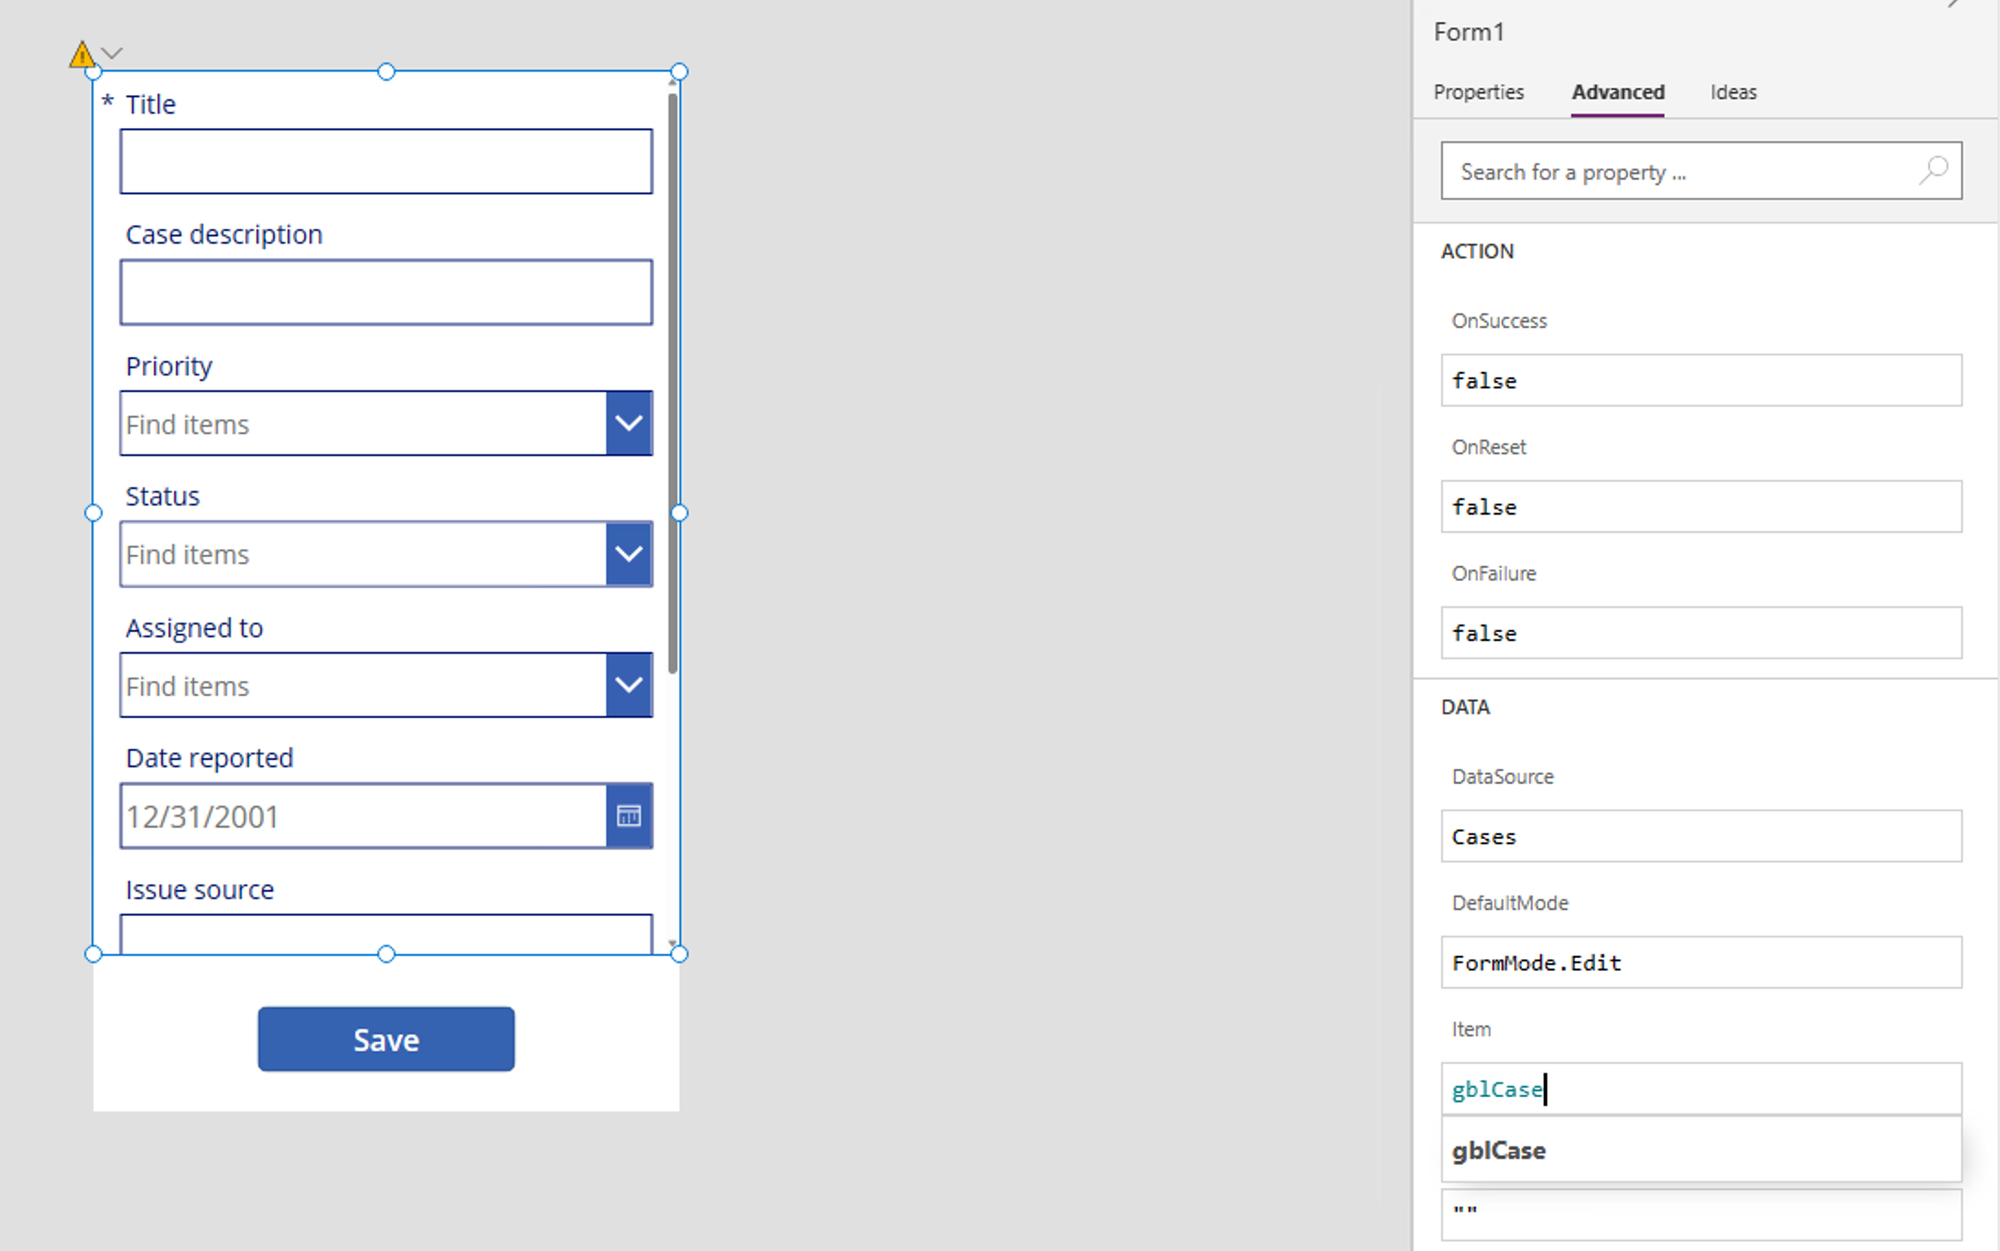
Now I’m going to save and publish my app and head back to Power BI. Now if I drill through from one of my records on my Cases page in my report here…
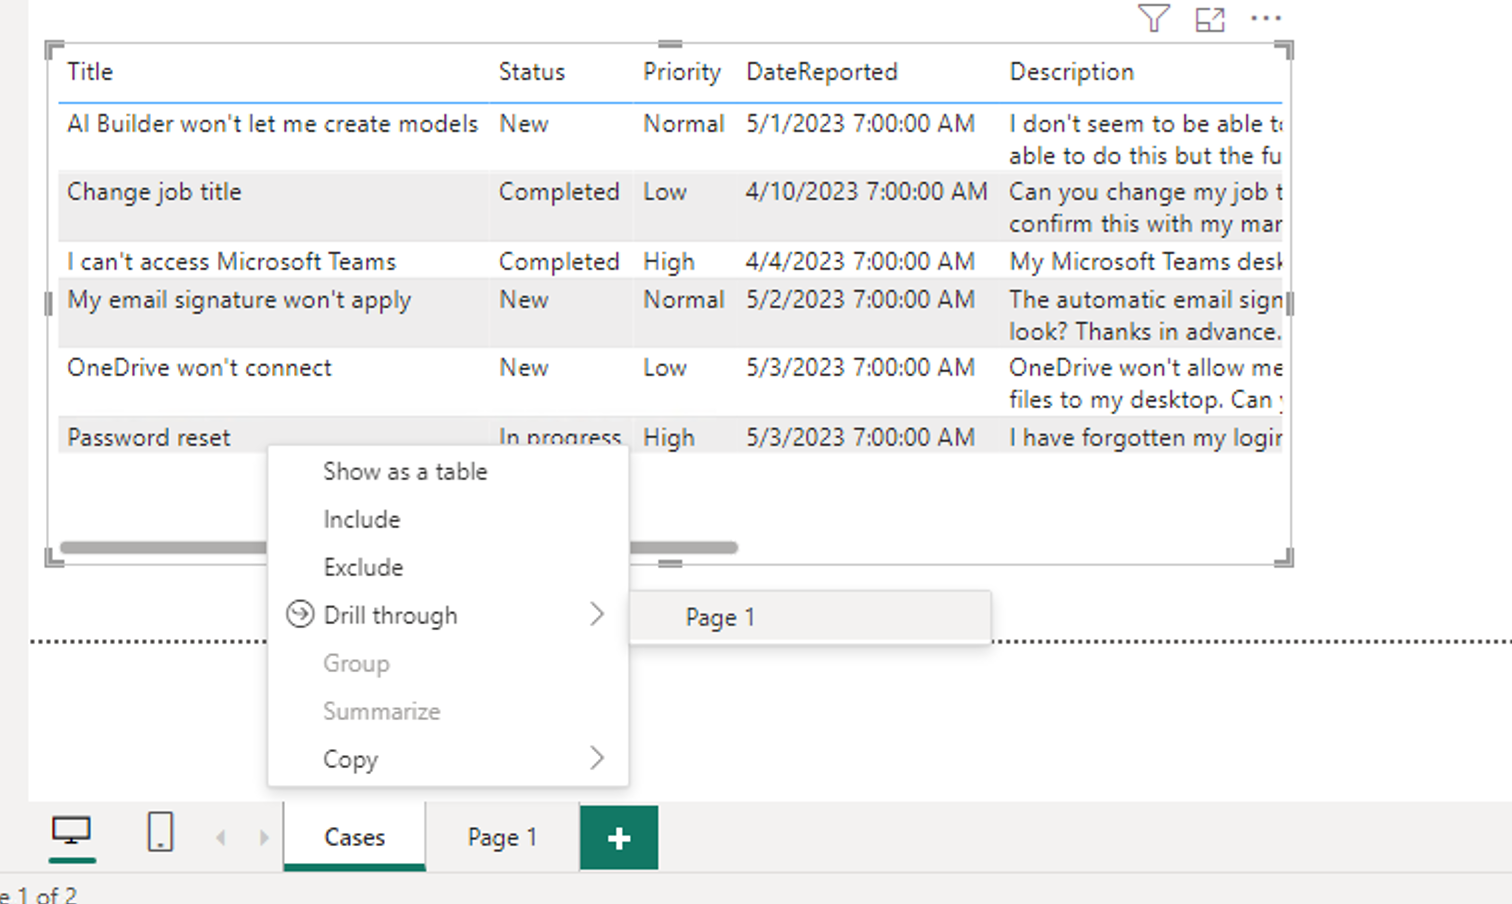
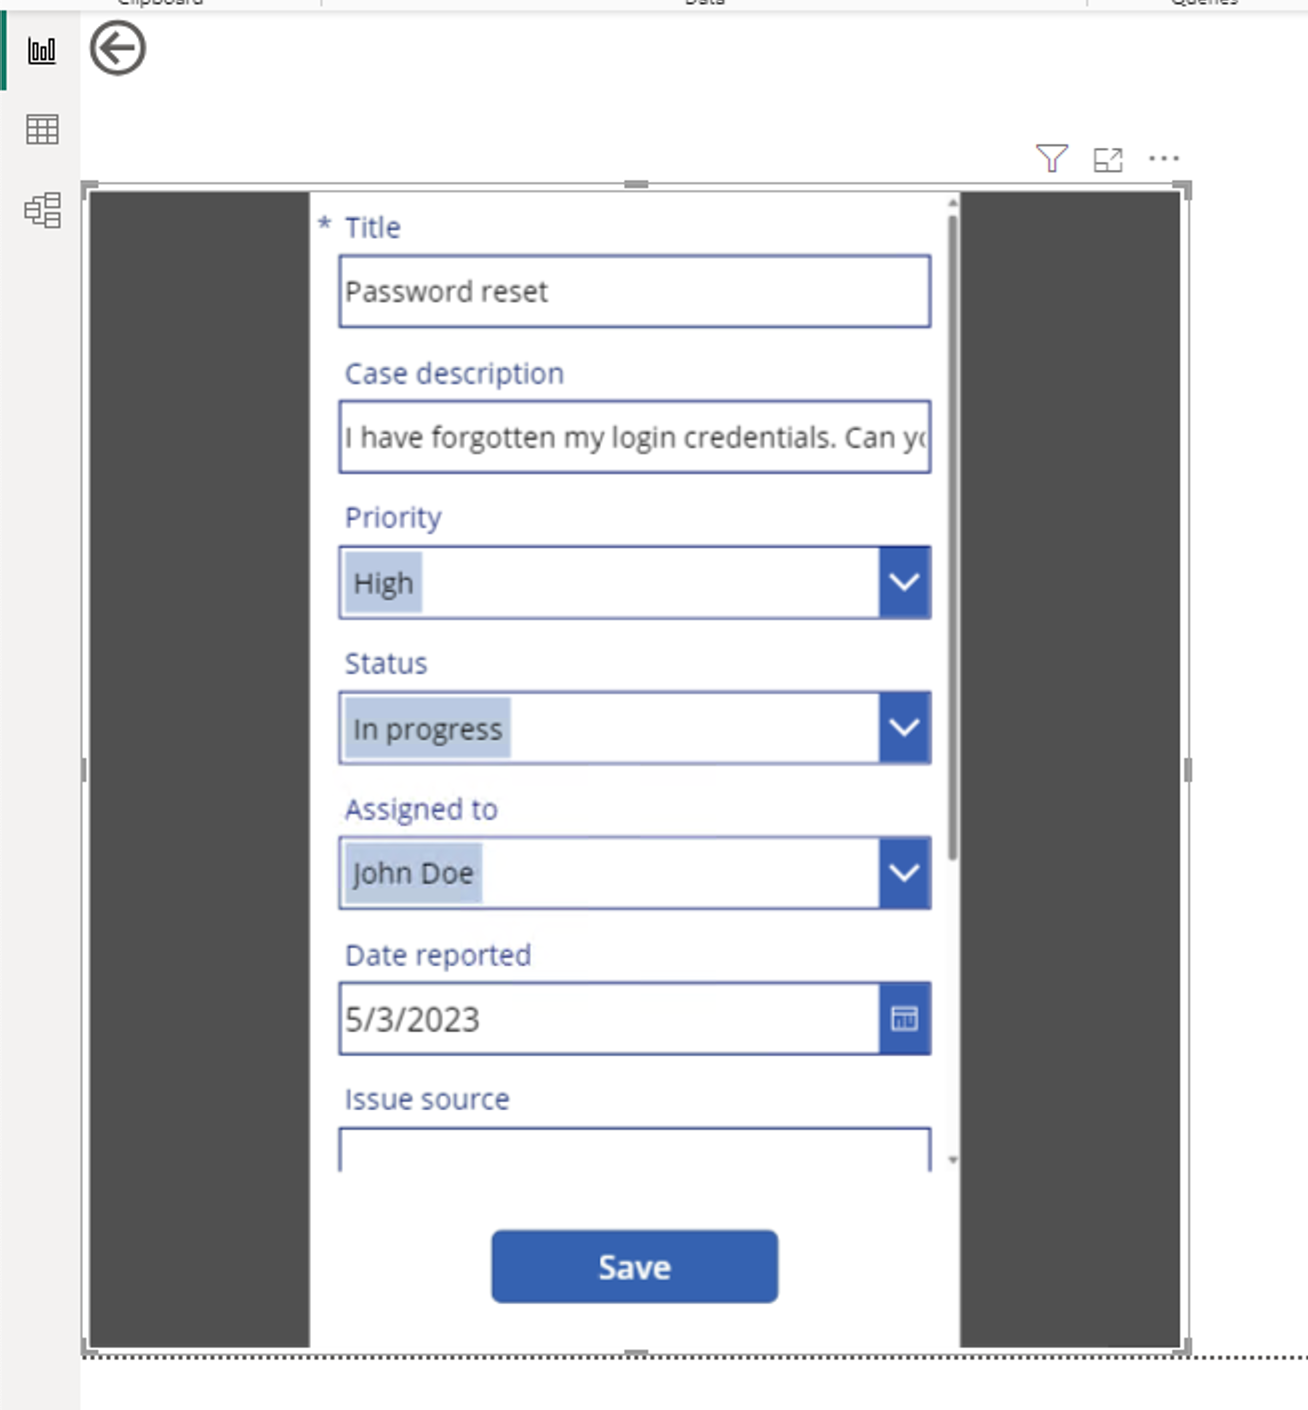
I’ll end up with a form to edit the details on the record and save and update them! Now I’m able to allow users to take action on things they spot in reports in Power BI! 📈 🚀
Did you like this content? 💖
Did you like this content? Check out some of the other posts on my blog, and if you like those too, be sure to subscribe to get my posts directly in your inbox for free!
Subscribe
