When debugging your apps, do you ever wish you had something similar to the likes of console.log() in JavaScript, to create custom logs in the monitor to support?
Well in this blog post I’ll show you how to do just that!
Trace()
To do this, we’ll use something very simple which is the Trace() function. The trace function effectively works in the same way as console.log() does in JavaScript.
Here’s the syntax for Trace()
Trace( Message [, TraceSeverity [, CustomRecord [, TraceOptions ] ] ] )
I’ll just focus on the message and severity elements here for now.
Using the message we can write the content we want to the monitor log in the same way that we would put content inside the rounded brackets for console.log()
Then following a comma we can determine the severity of what we have written to the monitor.
The options are as follows.
TraceSeverity.Information (default), TraceSeverity.Warning, TraceSeverity.Error, or TraceSeverity.Critical
Testing it out
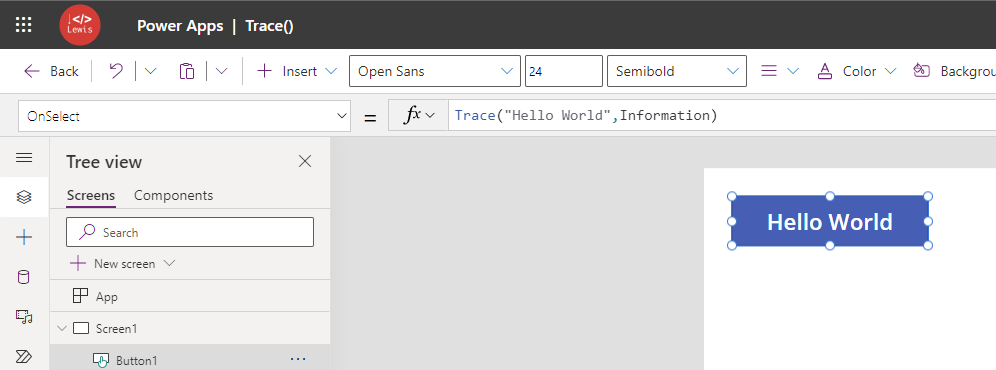
Okay, let’s test this out! I’m very simply going to create a new app and add a button to the screen and set it’s on Select as the following…
Trace("Hello World", TraceSeverity.Information)
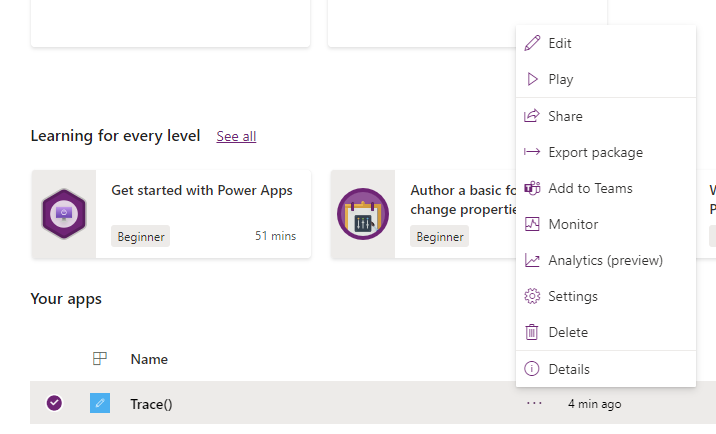
Now I’ll open my published app with a monitor session.

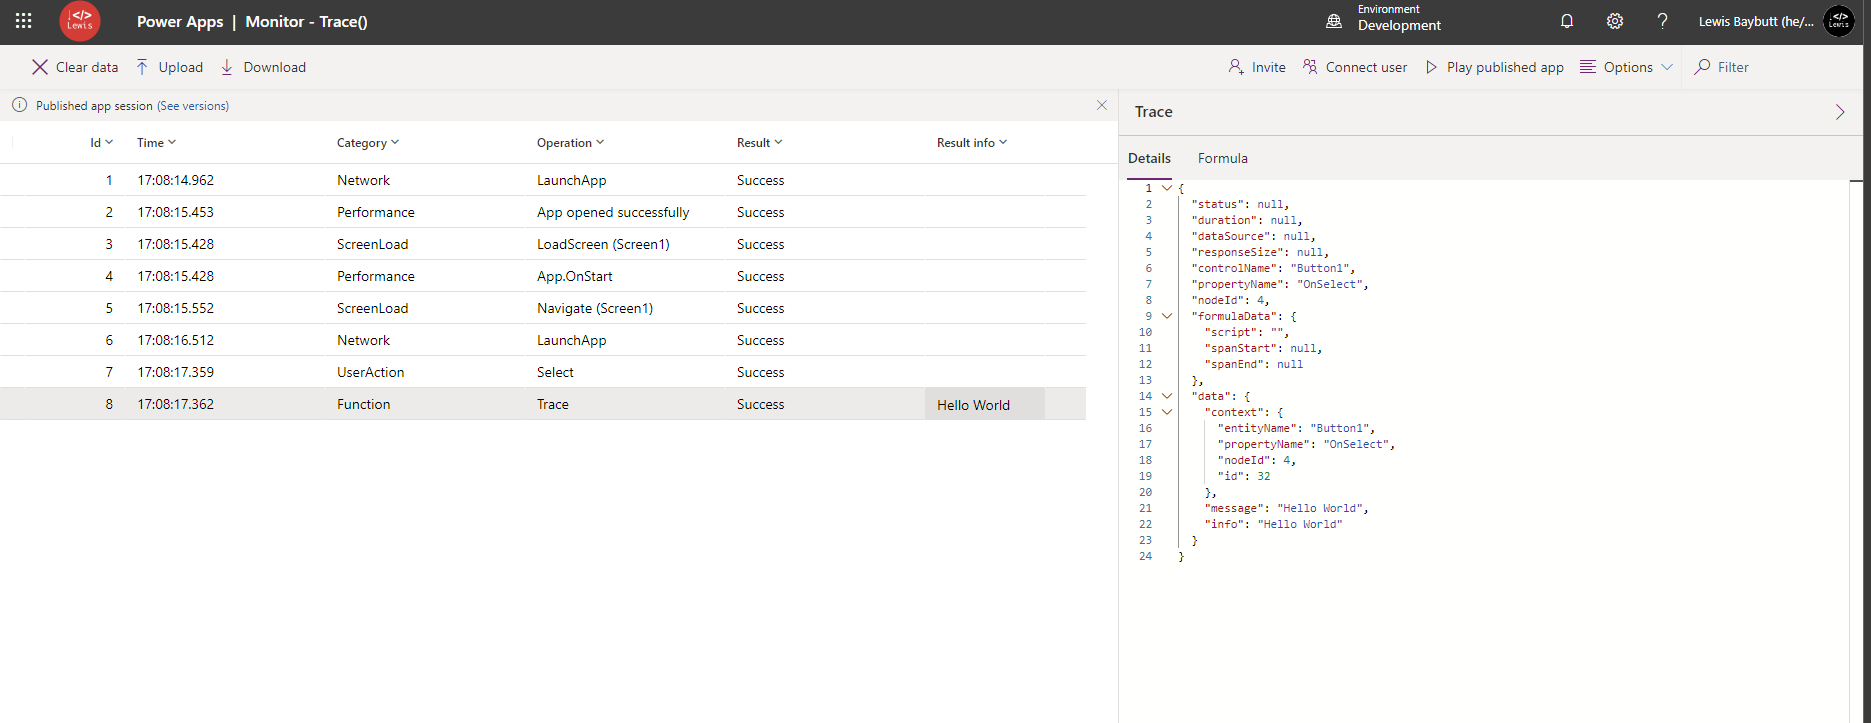
And now I’ve clicked my button in my linked monitor session and check out the log!

Super simple, but hopefully this helps with debugging your apps in Power Apps!

